What’s working for your brand?
Businesses have been pushed to include social media into their marketing strategies as consumers become more dependent on them. A Social Media Marketing Strategy helps pave a clear path towards your marketing objectives and goals. But once you’ve put it into action, how do you know if it’s working? Is it the best approach to reach the objectives and goals? Are there enough interactions/reach/followers? How were this months/quarters results compared to the previous?
All these questions should be answered in a Social Media Marketing Report. It will tell you how effective your social media campaigns are, where you need to make adjustments, redirect your attention, budget, energy, what type of content is working, and/or which posting times work best.
Basically it measures your social media marketing strategy from all angles.
Gaining Important Insights
Not all results will be useful to your marketing report. Looking at what is most important to your company and strategy objectives will determine which results to include and pay close attention to. Common things to include are follower growth, referral traffic, engagement, and conversions.
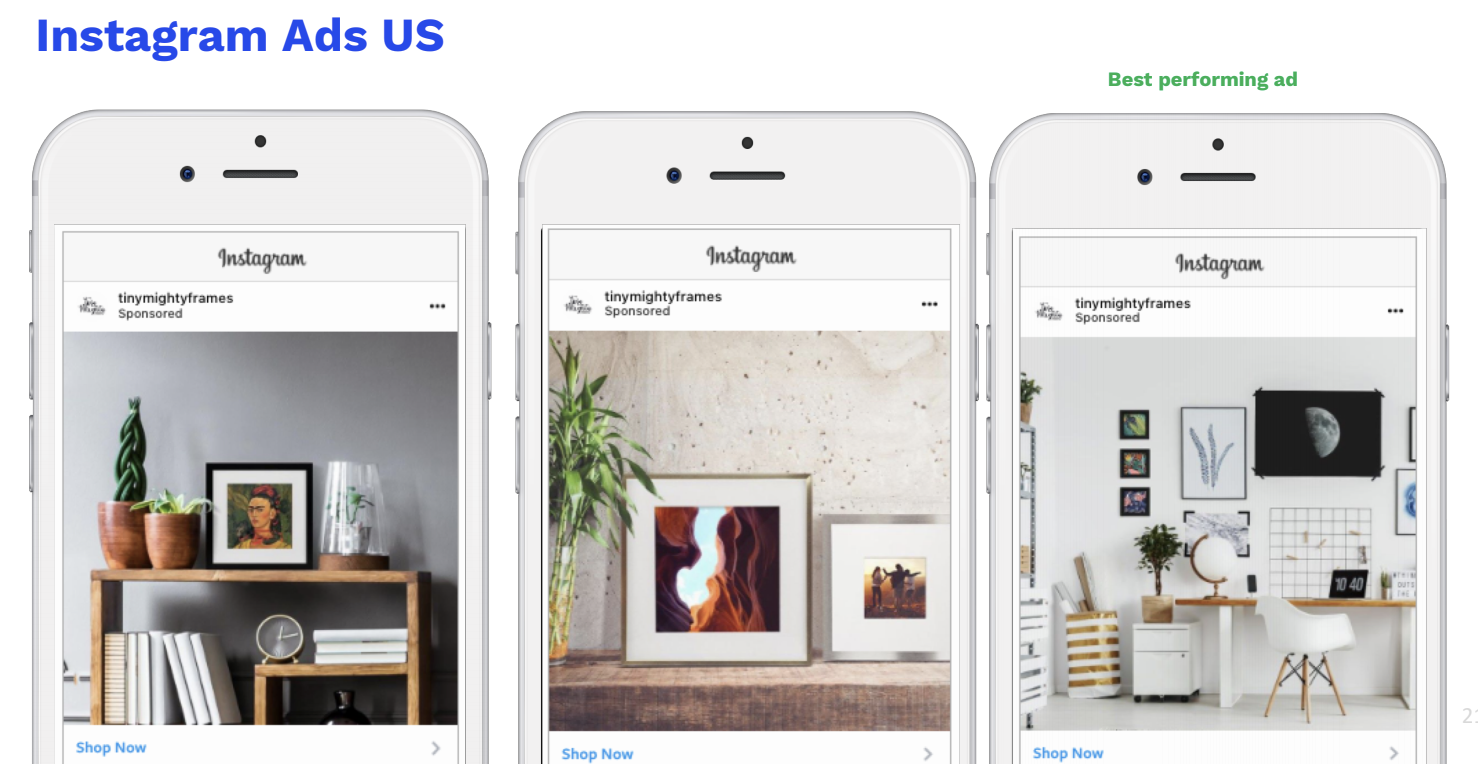
An example straight from the Venga Brands files is a marketing report for client Tiny Mighty Frames, a frame company. When TMF asked Venga to rebrand their company, Venga curated a social media strategy to help them become more competitive online, and create awareness.
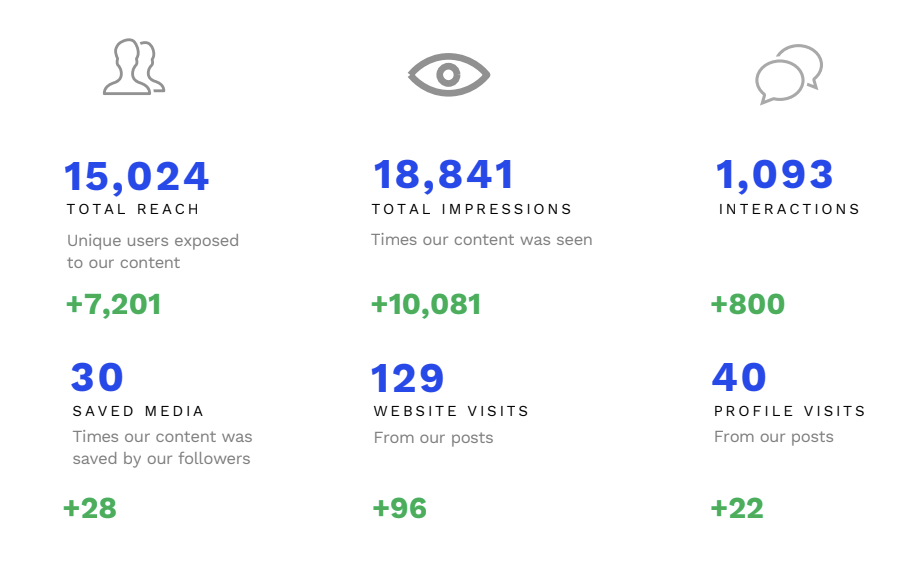
Analytic tools were used to track Venga’s efforts such as Google Analytics, Facebook Analytics, Instagram Insights, and Pinterest Analytics. From these tools, Venga pulled measurements for reach, impressions, and page visits from each platform. These metrics help analyze which campaigns are working or the type of content consumers are responding to; video, blogs, or pictures. Likewise, it also tells which platforms are bringing in the most traffic and therefore can narrow your network options.
Sure, there’s way more information you can gather from your analytic tools but tracking every last detail will pile large amounts of data and stray you from your focus. Not to mention the extra amount of time and energy it would take to do so. Take it from us, only include the most relevant data.


Demonstrations above are merely examples of what Venga Brands does for TMF and how we present insights.
How Often is the Right Amount?
Depending on the company or client you are working for, the report frequency can vary. This depends mostly on what you are trying to accomplish.
Weekly reports are useful when startups or businesses social strategies are constantly changing. These reports are more descriptive and can help you prioritize tasks.
Monthly reports are also good for changing strategies and just as good for observing and tracking results, without the hassle of providing one every week.
Quarterly reports are best used when tracking general results, i.e. which platforms are more successful and the redirection of strategies, as well as canceling out the ones that aren’t working.
Observing from the previous week, month, quarter or year will help show the progress you’ve made. For example, seasonal businesses might want to look more into comparing the same time periods over different years.
Results: Use them Wisely
There can be a large range of results. They’ll tell you what is working and what isn’t; both are valuable if you know how to use them. Good and bad results should inspire some type of action. For example, if your Pinterest page is generating the most traffic, you have a few options to work from: 1) invest more time on your Pinterest content and efforts or 2) change your strategic plan for your other platforms. In this scenario, 1 might make the most sense, unless you’re trying to reach new segments on different platforms. Again, always consider your company’s goals and objectives first before deciding which route to take.